


Bring Google Analytics to Your Digital Signage
By bringing Google Analytics out of the browser and onto your digital signage, you create a culture of transparency and data-driven decision-making.
Using Looker Studio (formerly Google Data Studio) and OptiSigns, you can have a live, professional analytics dashboard on your screens in less than 15 minutes.
Why Display Google Analytics on Digital Signs?
A wall-mounted dashboard ensures everyone—from marketing to management—sees the "pulse" of the company at a glance. The standard Google Analytics template includes:
- Core Metrics: Users, Sessions, Page Views, and Bounce Rate.
- Traffic Sources: Geographic breakdown and top-performing channels.
- Audience Insights: Engagement by demographic.
Let's Dive In!
How To Display Google Analytics Dashboards with OptiSigns
Step 1: Access Looker Studio
Looker Studio is Google’s free business intelligence tool. It allows you to transform raw data into beautiful, easy-to-read dashboards.
Go to lookerstudio.google.com and log in with your Google Account.
Step 2: Link Your Google Analytics Data
To show your real-time data, you need to connect your account as a source.
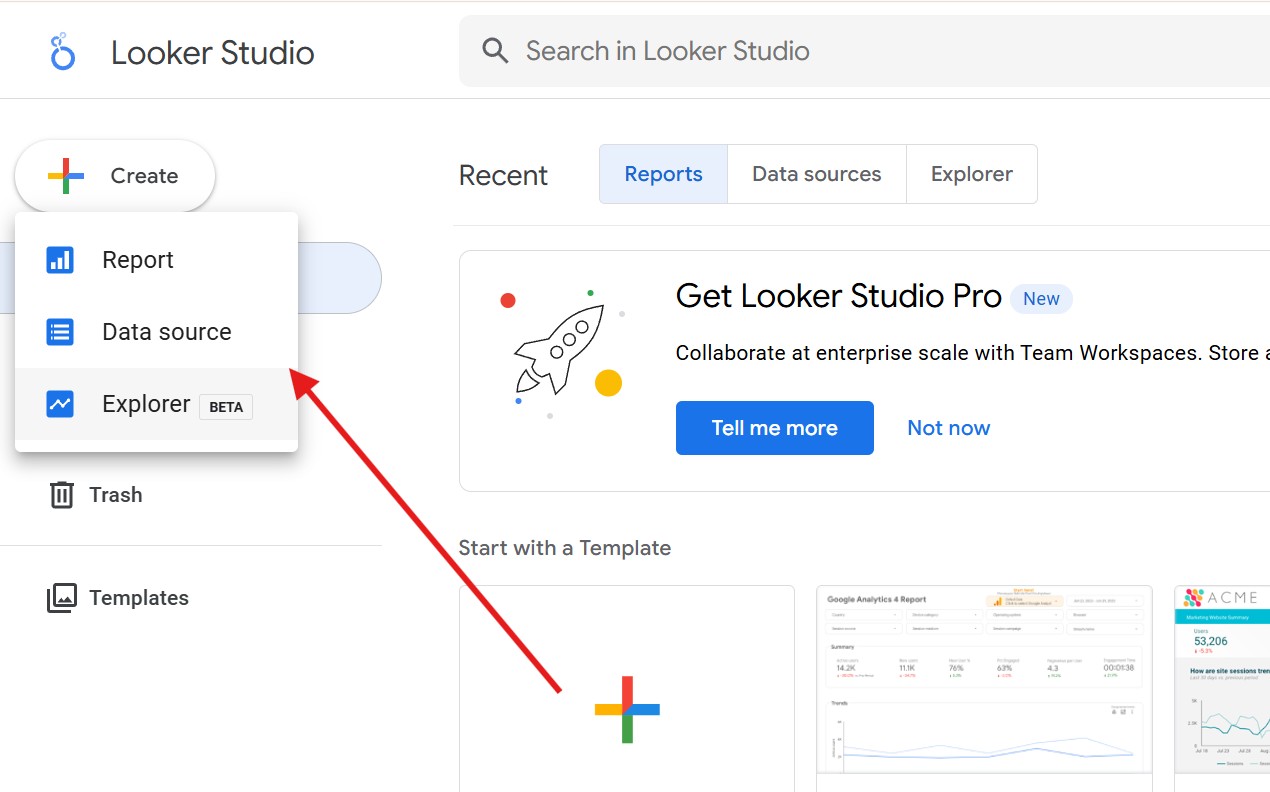
- Click the Create button in the top left and select Data Source.
- Select the Google Analytics connector.
- Click Authorize to grant Looker Studio access.
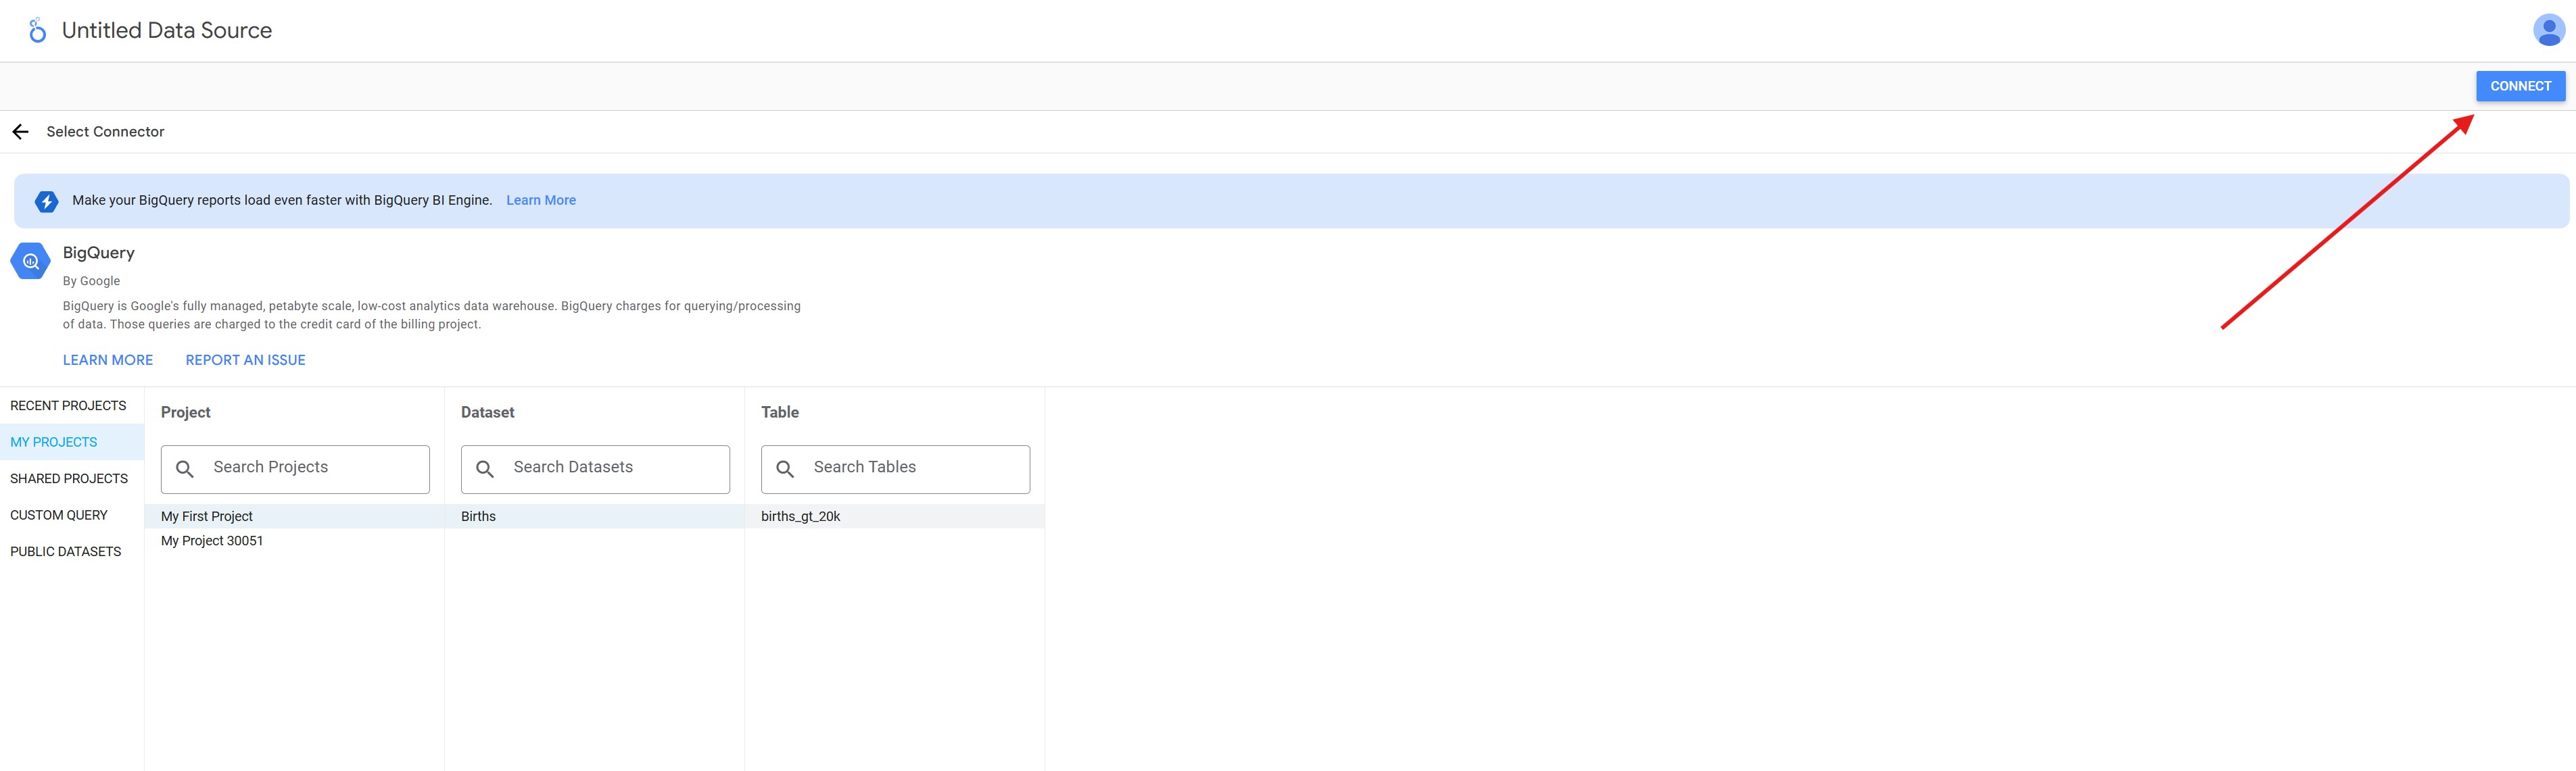
- Select the specific Account, Property, and View you want to display.
- Click Connect in the top right corner.
- Once connected, you can change the name of the data source.
Step 3: Generate Your Dashboard from a Template
You don't need to build a design from scratch. Google provides high-quality templates ready for use.
- Return to the Looker Studio home page and click the Templates gallery (or select the "Google Analytics" template).
- Once the template opens, click Use my own data or Use Template.
- Choose the Data Source you just created and click Copy Report.
- You can now rename the report, change colors, or add specific widgets.
- Get the Embed Code:
- Click Edit > Share > Embed report
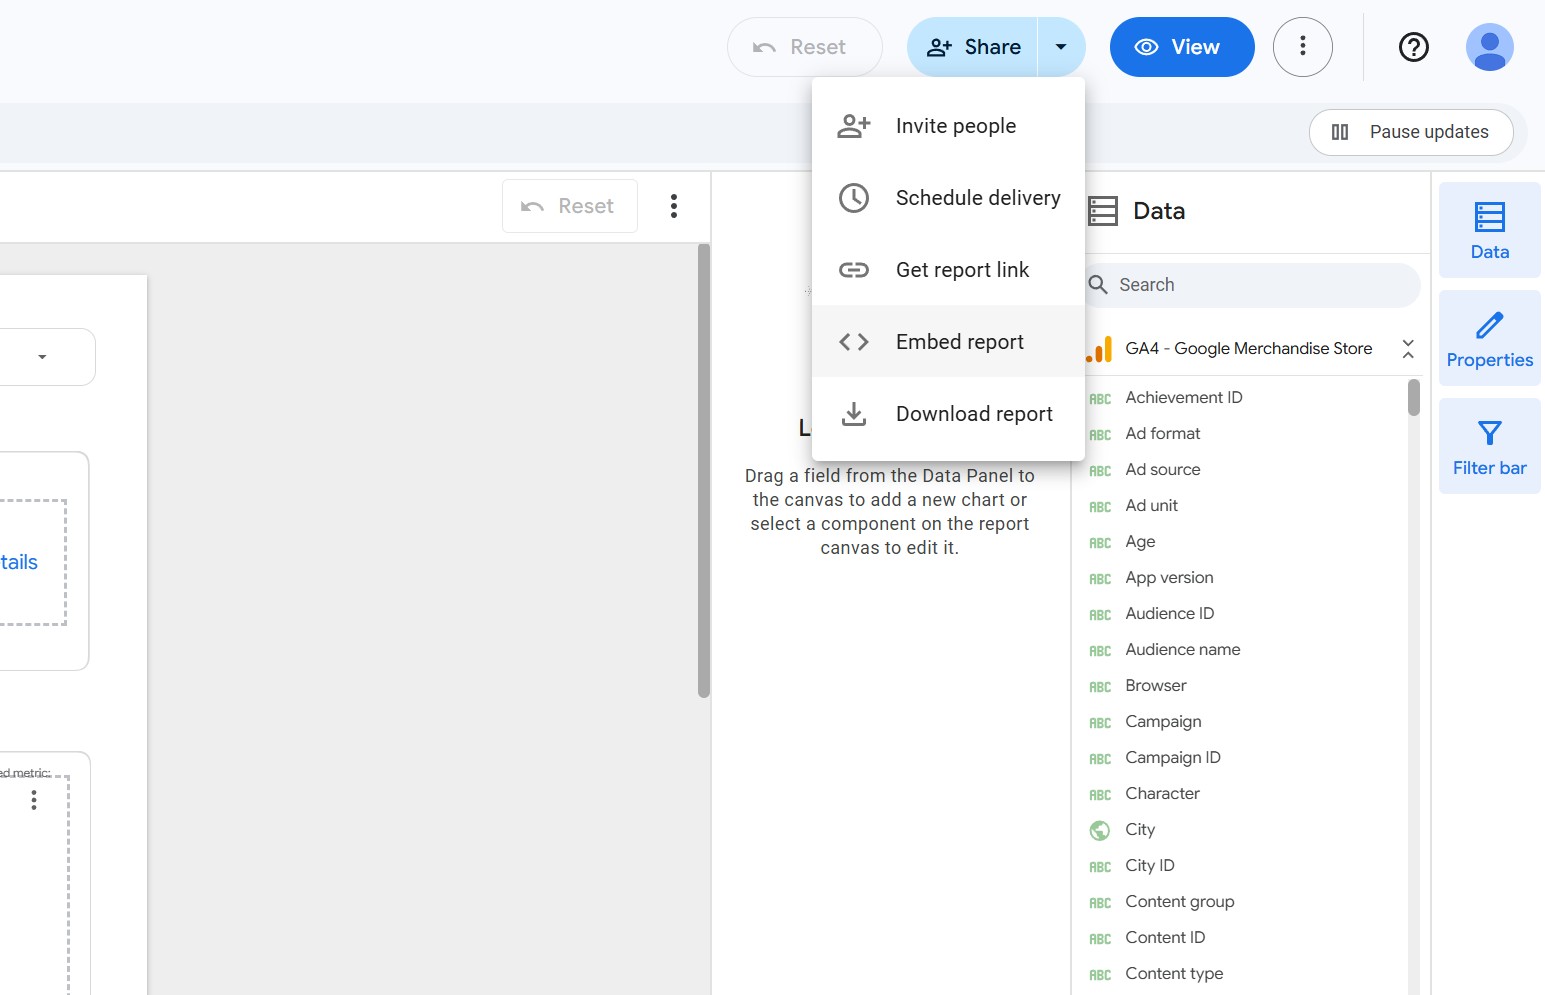
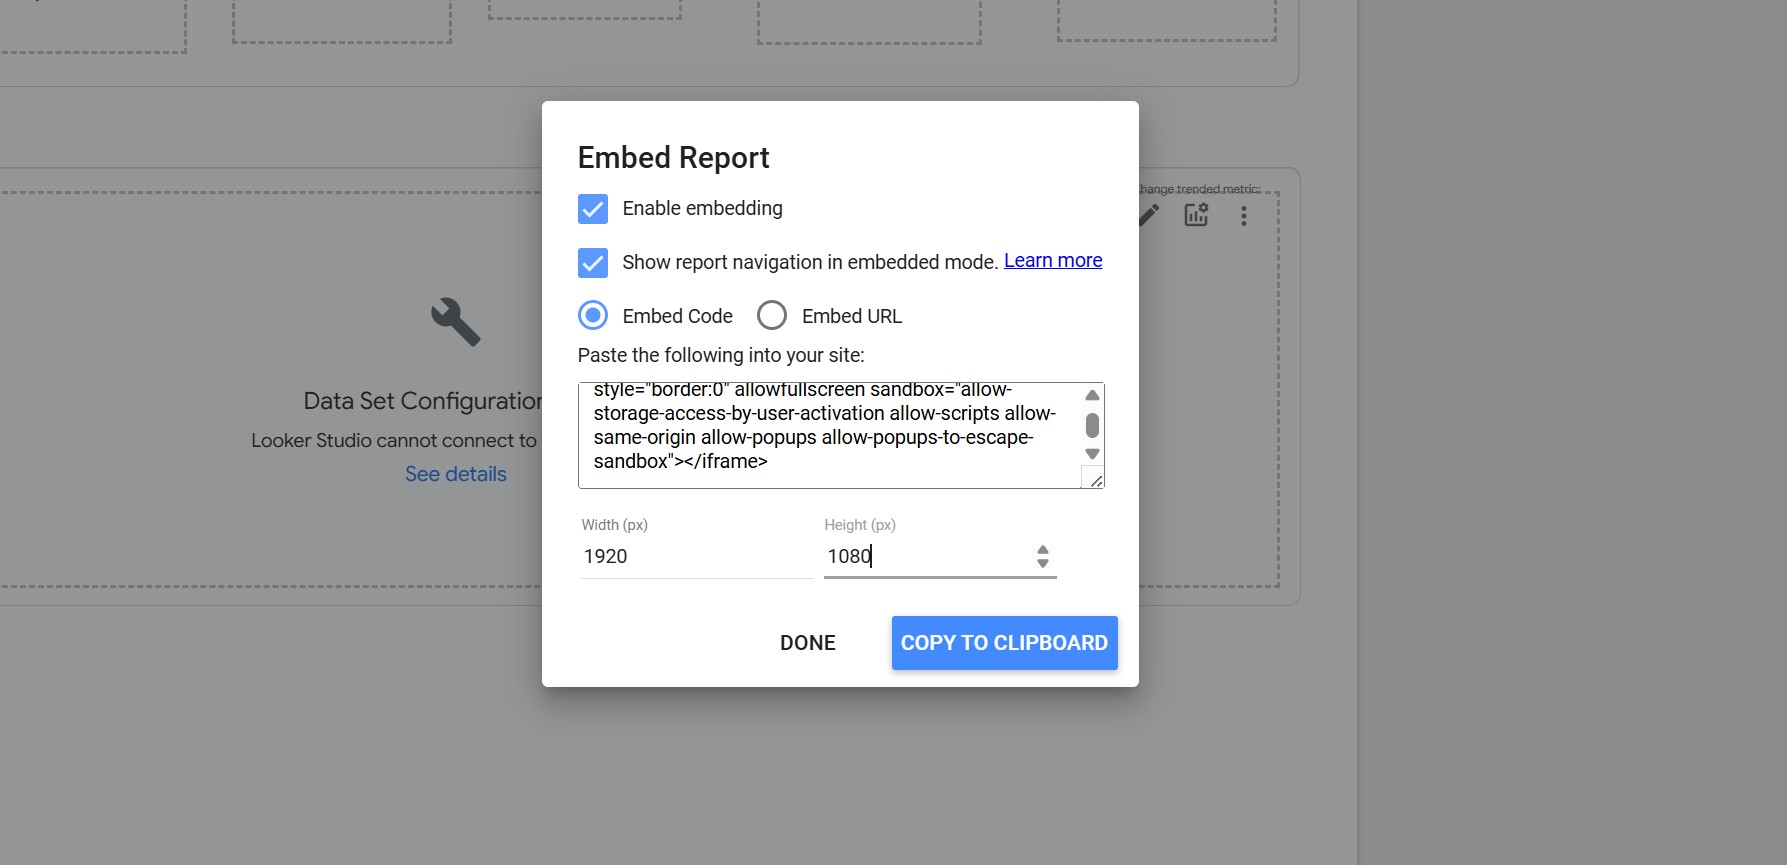
- Select Enable Embedding and choose Embed Code.
- Pro Tip: Set the Width to 1920 and Height to 1080. This is the standard resolution for most HD digital signs and ensures your data remains visible from a distance.
- Click Copy to Clipboard.
Step 4: Display the Dashboard via OptiSigns
Now that your dashboard is ready, it’s time to push it to your screens.
Log in to your OptiSigns Dashboard.
- Navigate to Assets and click Apps.
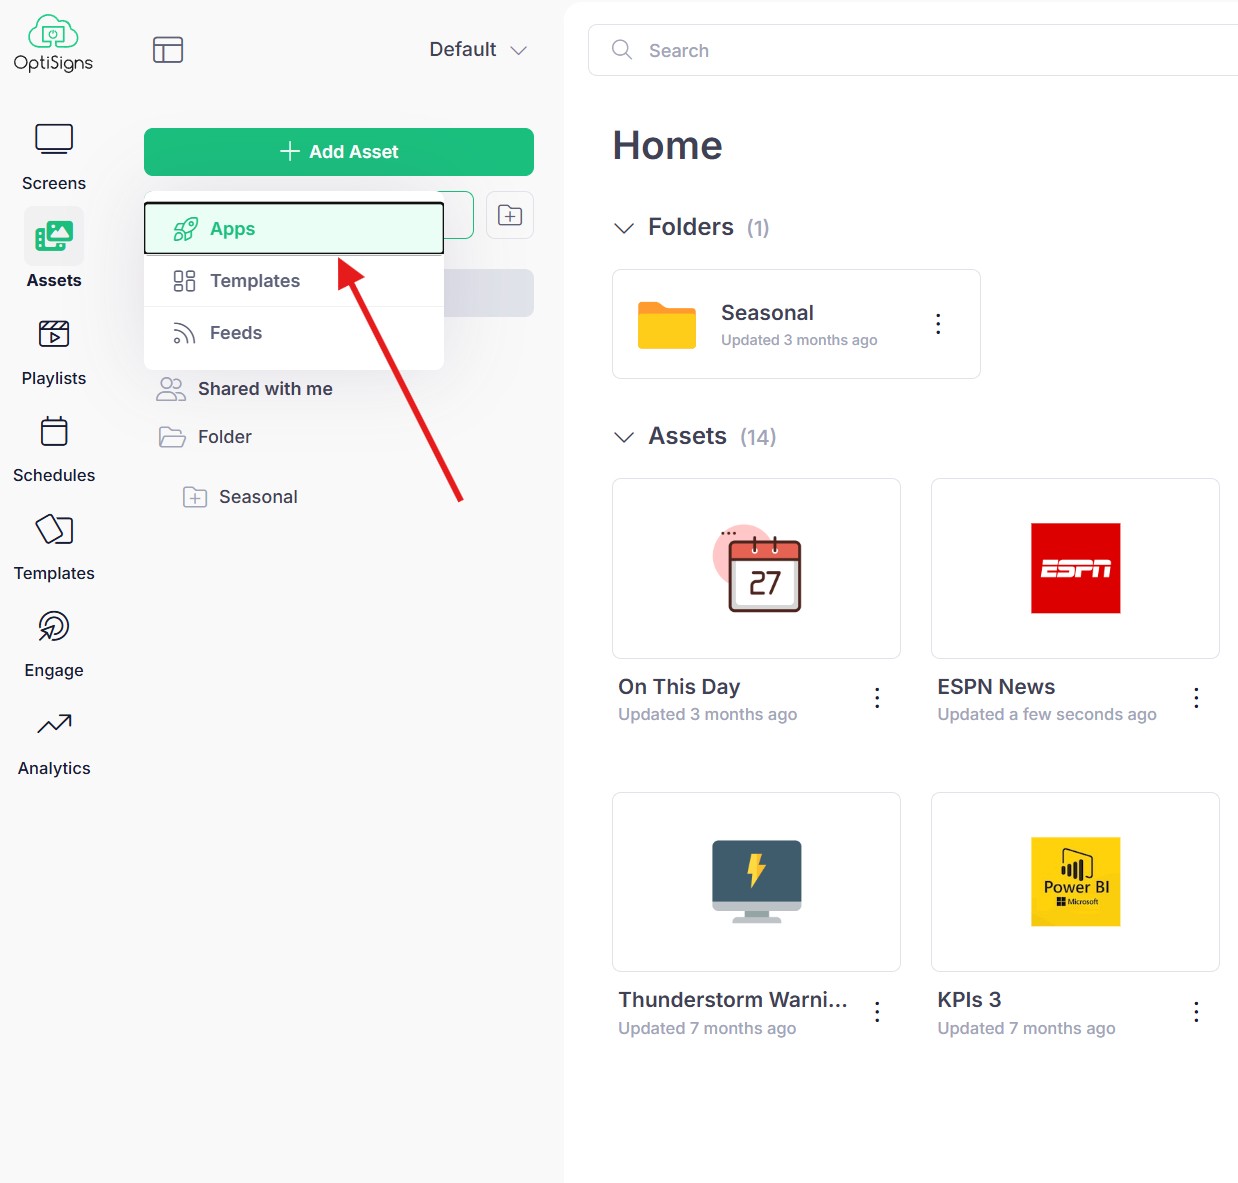
- Select the Google Analytics App.
- Configure the Asset:
- Give it a name (e.g., "Main Website Analytics").
- Paste the Embed Code you copied from Looker Studio.
- Set a Update Interval (this ensures your screen always shows the most recent data).
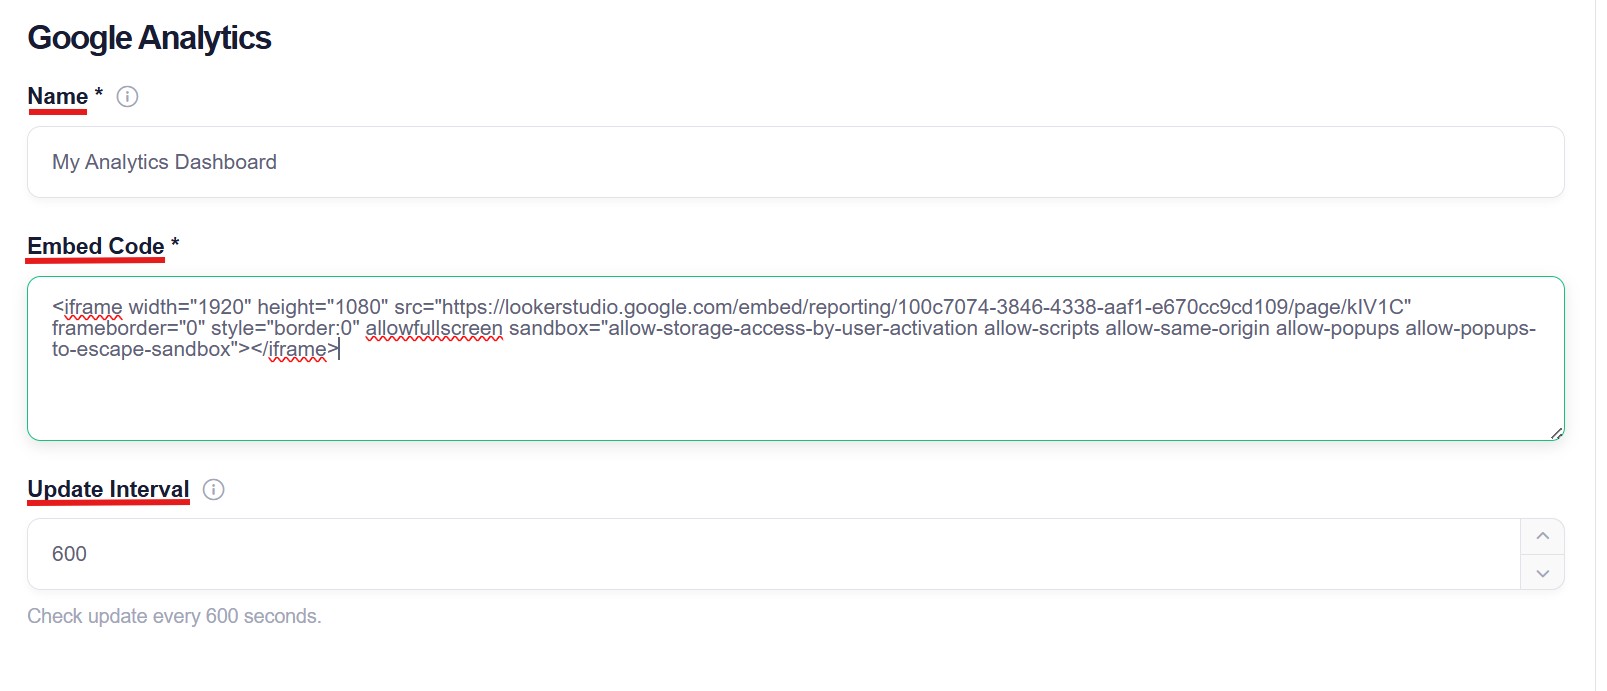
- Click Save.
That’s it!
Your Google Analytics dashboard is now an asset in your OptiSigns library. You can assign it to any screen, add it to a playlist, or schedule it to appear during specific times of the day.
.avif)


